Impact Opportunities Navigation Guide
Within the CGIAR context, Impact Opportunities can be defined as a subset of development needs. Often, impact opportunities lie along the intersection of crop production, consumption, and underdevelopment. The CGIAR's GloMIP Impact Opportunities Portal mainly aids in identifying target areas. To date, the Impact Opportunities dashboard offers over 200 indicators for over 40 crops being cultivated in 200 countries. This page aims to teach users how to navigate through the portal.
The Impact Opportunities Portal mainly tracks five (5) key Impact Areas: Nutrition, health & food security, Poverty reduction, livelihoods & jobs, Gender equality, equality, youth & social inclusion, Climate adaptation & mitigation, and Environmental health & biodiversity.
Several indicators can be used to quantify the level of underdevelopment within each Impact Area, which helps identify countries or crops on which to focus development efforts. Results are presented through figures and tables.
Details regarding the available indicators can be found in the Indicator Catalog. Symbols are attached after the name, which serves as a guide to the following information:
- 🌐 for spatial data aggregated at the national-crop level;
- 📄for tabular data measured at the national-crop level;
- 📈 projected into the future;
- 💲indicates benefit (rather than underdevelopment) indicators.
Depending on the user’s query, the Impact Opportunities Portal offers various methods of comparing absolute and relative values across regions, countries, crops, market segments, and traits. These methods may use a single or multiple indicators. Below are the tabs that can be used in the dashboard:
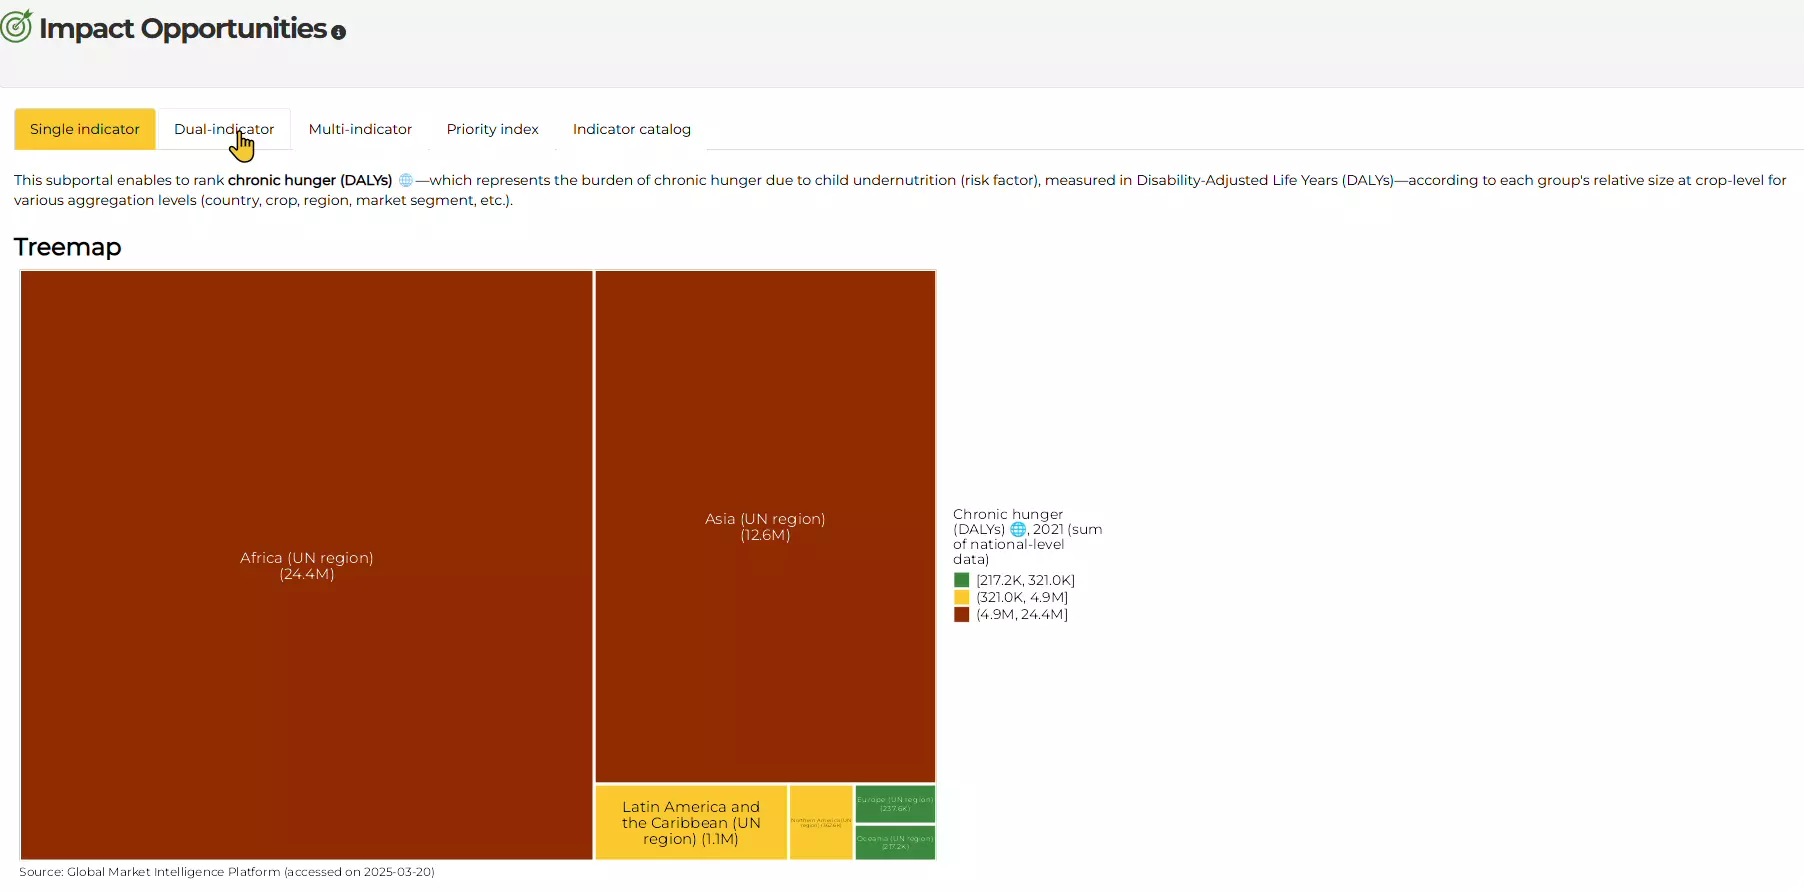
- Single Indicator focuses on one indicator for analyzing the performance of regions, countries, crops, market segments, and traits.
- Dual Indicator determines the correlation between indicators based on the reported values across regions, countries, crops, market segments, and traits.
- Multi-indicator presents a cross-sectional representation of indicators available in the Impact Opportunities Portal.
- Priority Index provides a numeric score of a region, country crop, market segment or trait based on the weighted performance of multiple indicators across the five Impact Areas.
The succeeding section of the guide presents two hypothetical scenarios where the Impact Opportunities Portal is applied to generate evidence. These scenarios suggest specific filter settings for discussion purposes. As such, these selections should not be considered the only options available.
Scenario 1: Identifying potential target countries for low glycemic index rice to regulate the incidence of type 2 diabetes (Single Indicator).
Premise: Identifying countries with rice as a main staple and a substantial number of their population experiencing type 2 diabetes can be identified as priority countries. As such, the Impact Opportunities Portal can be used to fill in this information.
From the Impact Opportunities Portal, select Nutrition, health & food security as an Impact Area, Diabetes type 2 (DALY/capita) as an Indicator, National-crop for Data Level, and Rice for Crop filter.
Note
You can select indicators by scrolling through the dropdown selection using the scroll bar or by typing your query in the search box. For ease of use, most of the dropdown menus within the Impact Opportunities dashboard have selection functions, such as select all and deselect all. It should be noted that, by default, Users should press the Deselect All button before selecting a subset of the available entries.
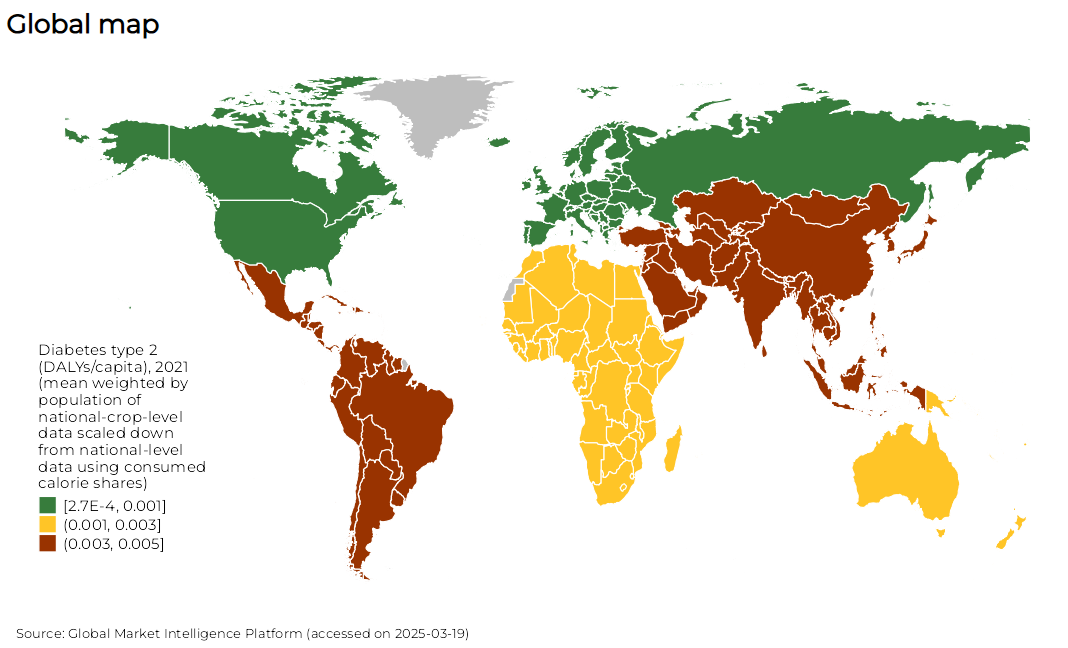
Selected results for Scenario 1 are presented in a Treemap, Global Map, and Data Table. The Treemap shows the results by the size of the rectangles proportional to the value differences. From the filter selection, it can be observed that Asia, Latin America, and the Caribbean (LAC) were the regions identified to have high values.
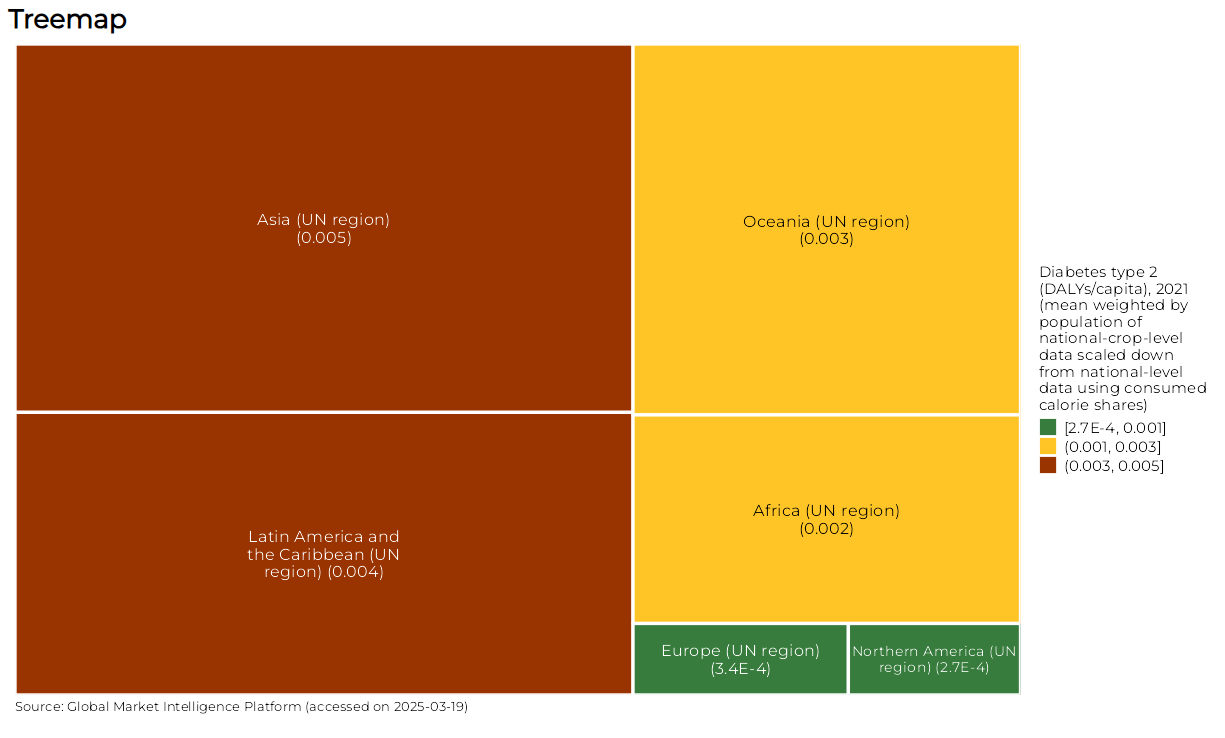
Selected results for Scenario 1 are presented in a Treemap, Global Map, and Data Table. The Treemap shows the results by the size of the rectangles proportional to the value differences. From the filter selection, it can be observed that Asia, Latin America, and the Caribbean (LAC) were the regions identified to have high values
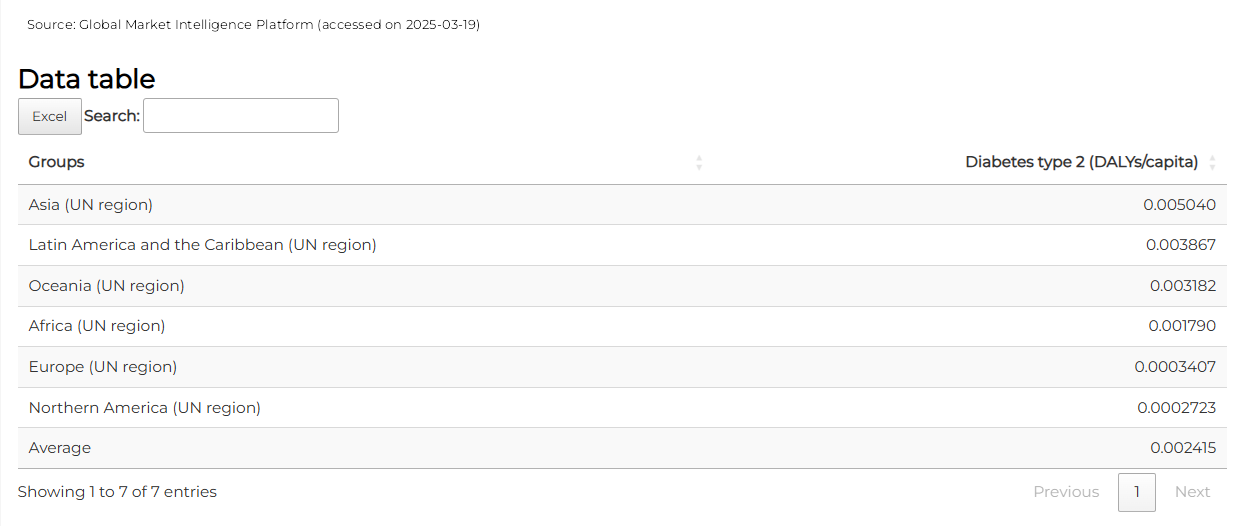
The Data table presents the numeric valuation of the filter selection. The results are arranged by default in descending order, with the highest value at the top. Depending on the selected indicator, the aggregation value may be an average (summation over the total observations) or total (sum of observations). Users can easily download the results of the Data table by clicking the Excel button found at the top of the Data table.
In addition to the tables and figures generated by the dashboard, the Impact Opportunities Portal also has a Suggested Interpretation, which can serve as a guide for explaining the dashboard's results

Lastly, the Metadata section provides the user with the data sources and the necessary information to verify their validity. The section also informs the user when the data was officially released and lists the missing data that were imputed.

Scenario 2: Strategically manage the allocation of CGIAR’s financial resources for crop breeding (Priority Index)
Premise: Developing new crop varieties requires substantial financial resources. Determining Impact Opportunities guides decision-makers in deciding priorities.
To answer this question, we can set the Impact Opportunities dashboard to the Priority Index tab and set the following filters to the following:
- Impact Areas: Select All (default)
- Nutrition weight: Select All (default)
- Poverty weight: 0.20 (default)
- Gender weight: 0.20 (default)
- Climate weight: 0.20 (default)
- Environmental weight: 0.20 (default)
- Indicators: Select All (default)
- Data level: National-crop
- Show data by: MS Subregion-crop
- Country filter: Africa (UN region), Asia (UN region), Latin America and the Caribbean (UN region)
- Crop filter: CGIAR crops
- User weight (future): 50% (default)
- User weight (breadth): 50% (default)
Note
The Priority Index tab of the Impact Opportunities dashboard offers weights in the tab’s toolbar to control how the indicators are valued. Currently, there are two groups of weight filters in the dashboard bar.
-
The Impact Area weights give the users control over how to value each impact area before generating the priority index score. For example, the user can set Poverty to 0.6 and the other impact areas 0.1 to assign more value or priority to poverty reduction initiatives.

-
The present versus future user weight refers to the slider that controls the proportion of “Present” and “Future” Indicators used to compute the Priority Index. This function allows the user to limit or remove Indicators that contribute to a more “present-looking” or “future-looking” index score.

-
A breadth versus prevalence user weight controls the proportion of Indicators representing breadth or prevalence. Breadth indicators can be referred to as absolute indicators that quantify the magnitude of underdevelopment. An example of this type of indicator is the population in poverty. Meanwhile, Prevalence indicators represent relative values, irrespective of the target’s size, such as the proportion of the population in poverty.

- Setting a user weight to 50% indicates pushes the dashboard without exclusions.
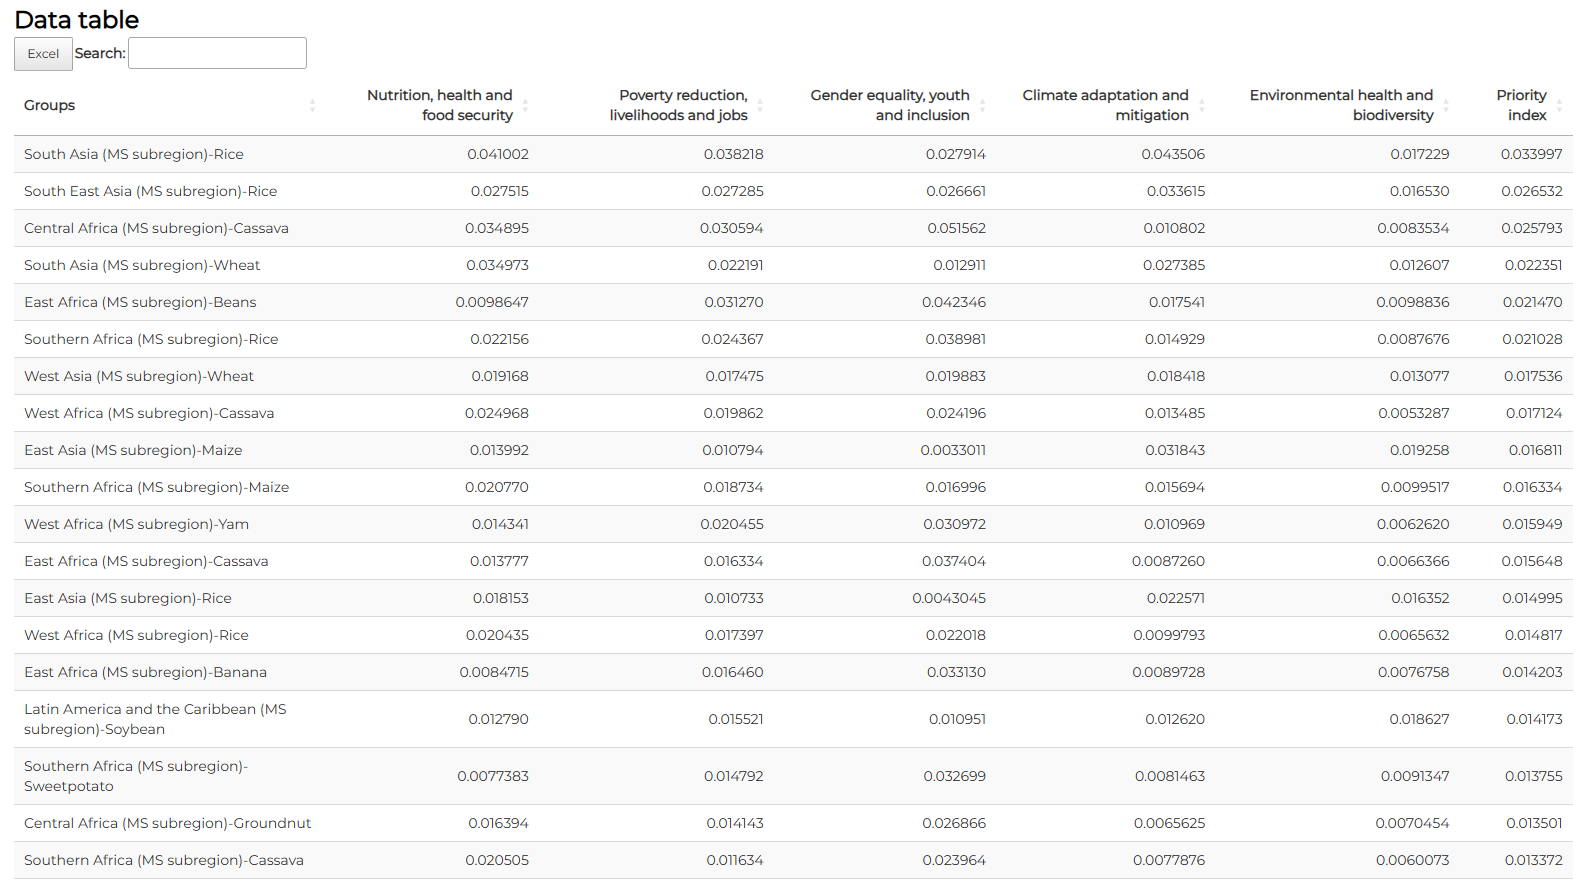
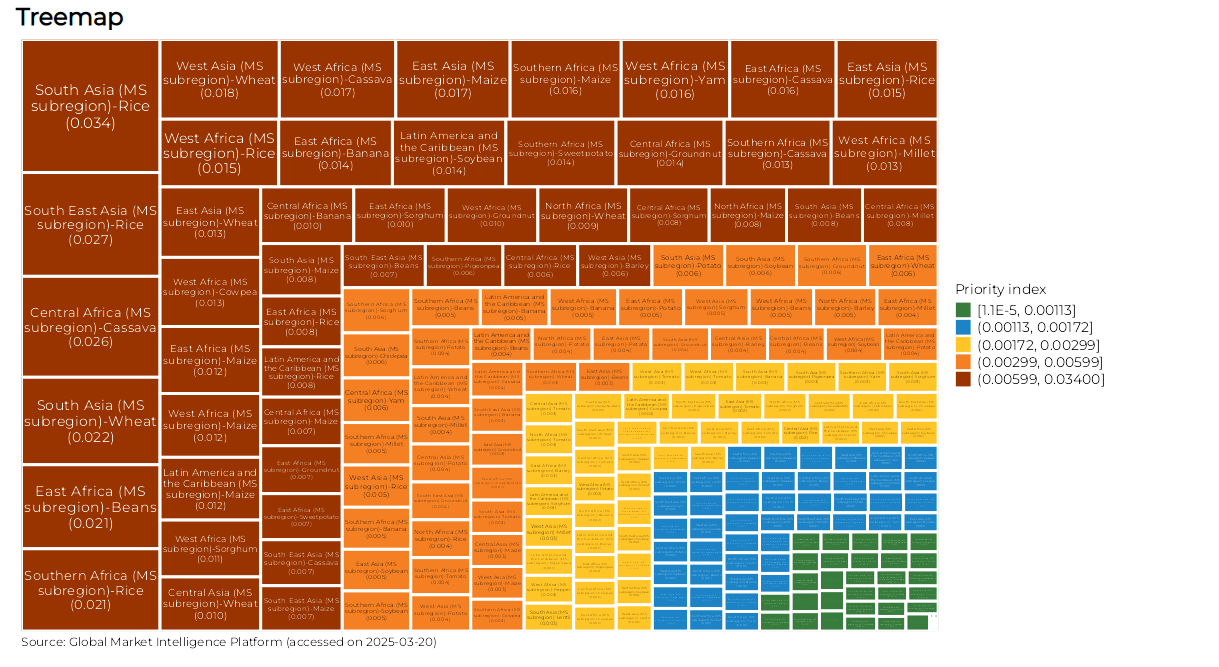
Results of the filter selection are presented in a Treemap and Data table. From the Treemap, we can identify rice in South and South East Asia, Cassava in Central Africa, Wheat in South Asia, and Beans in East Africa.
The Data Table presents the breakdown of the indexed scores across the five (5) impact areas. We can translate the outcome for South Asian rice, which shows concerns about Climate (0.024), Nutrition (0.023), and Poverty (0.023). Based on this information, we can develop a breeding program that addresses these concerns.
